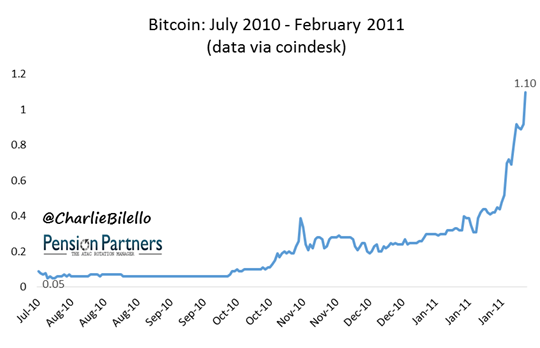
In July 2010, Bitcoin was trading at 5 cents. By February 2011 it was trading at $1.10. That’s a 2,100% return in 7 months. This is what the chart looked like at the time…
What’s the first word that comes to mind? Bubble.
Indeed, and over the next two months that bubble would burst, as Bitcoin declined nearly 50% to a low of 56 cents.
And then, this happened: Bitcoin came right back, advancing another 2,801% above its February 2011 peak to $31.91 by June 2011.
What does that chart look like to you? An even bigger bubble, and by this point the media was starting taking notice.
Source/More: When Does a Bubble Become a Bubble? | PensionPartners.com

